Mastering Candlestick Patterns: A Comprehensive Guide to Stock Trading and Technical Analysis
Candlestick patterns have long been regarded as a cornerstone of technical analysis in stock trading. These visual representations of price movements offer valuable insights into market psychology, trends, and potential reversals. In this article, we delve into the world of candlestick patterns, exploring their significance, application, and the challenges traders face in utilizing them effectively to make informed decisions in the stock market.
Understanding Candlestick Patterns
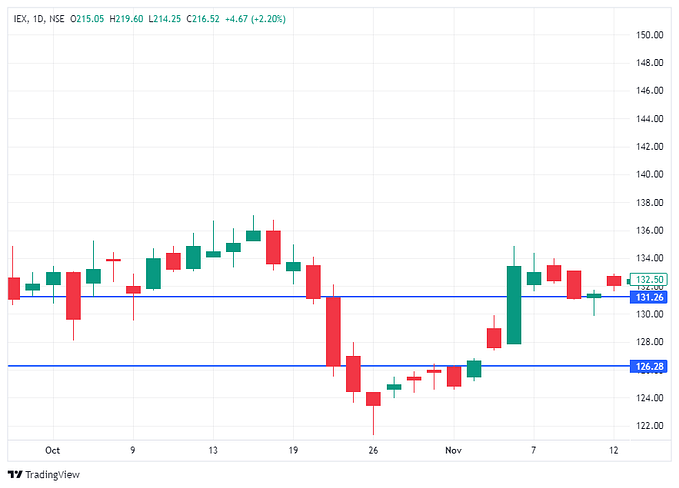
Candlestick patterns originated in Japan centuries ago and have since become a fundamental tool for traders worldwide. These patterns, displayed on candlestick charts, provide a graphical depiction of price action over a specific time frame. Each candlestick represents the opening, closing, high, and low prices for the period, with colors indicating bullish (green or white) and bearish (red or black) sentiment.
Key Candlestick Patterns
Among the myriad candlestick patterns, several hold particular significance for traders. The “hammer” and “hanging man” patterns, discussed in detail in the transcript, are examples of single-candle formations that signal potential trend reversals. While hammers suggest bullish reversals after downtrends, hanging man patterns indicate potential bearish reversals following uptrends.
Tradeoffs and Challenges
While candlestick patterns offer valuable insights, their interpretation requires careful consideration of various factors. Traders must balance the significance of individual patterns with other technical indicators, market trends, and risk management strategies. Moreover, the subjective nature of pattern recognition introduces the risk of false signals and misinterpretation, emphasizing the importance of validation and confirmation before making trading decisions.
Importance of Technical Analysis
Technical analysis, of which candlestick patterns are a crucial component, enables traders to analyze historical price data and identify potential future trends. By understanding market dynamics, support and resistance levels, and pattern formations, traders can make more informed decisions regarding entry and exit points, risk management, and profit targets.
Making Money in Stocks
While mastering candlestick patterns and technical analysis can enhance trading proficiency, success in the stock market requires a comprehensive understanding of market fundamentals, investor psychology, and macroeconomic factors. Moreover, disciplined risk management, continuous learning, and adaptability are essential traits for successful traders aiming to navigate the complexities of stock trading.
Conclusion
Candlestick patterns serve as invaluable tools for traders seeking to decipher market sentiment and anticipate price movements. However, their effectiveness hinges on a nuanced understanding of technical analysis, risk management, and broader market dynamics. By integrating candlestick patterns into a holistic trading strategy and remaining vigilant to emerging trends and signals, traders can enhance their probabilities of success in the dynamic world of stock trading.
In summary, mastering candlestick patterns is a journey that requires dedication, practice, and continuous learning. As traders navigate the complexities of the stock market, a well-rounded approach that incorporates technical analysis, fundamental research, and prudent risk management can pave the way for sustained profitability and success.